Current Factor Structure · 2025
What drives equity markets today
The 10 principal components of the current training window, ordered by variance explained. Together they capture 87.1% of variance in the 16-indicator dataset.
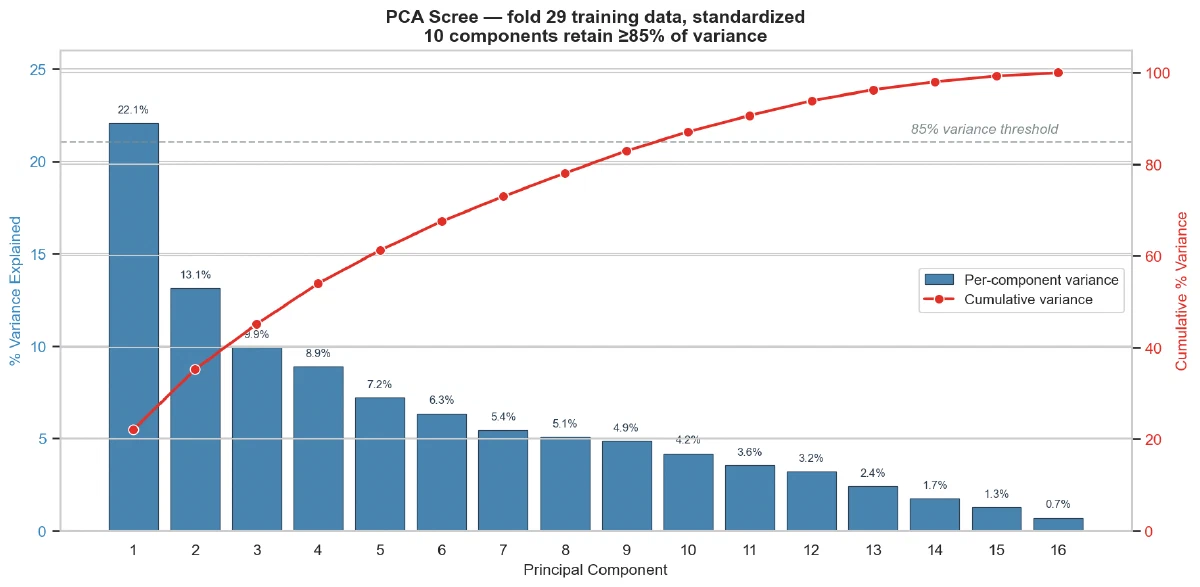
| Label | Variance | Cumulative | Top features |
|---|---|---|---|
| PC1 - Equity stress | 22.1 | 22.1 | SPX_200d_ma_spread (−), SPX (−), BAA10Y (+), BAA10Y_trend (+) |
| PC2 - Economic activity | 13.1 | 35.2 | MANEMP (+), SPX_from_52w_high (+), PERMIT (+), BAA10Y_trend (+) |
| PC3 - Rate levels | 9.9 | 45.1 | DTB3 (+), DGS10 (+), RVOL_trend (+), SPX_RVOL21 (+) |
| PC4 - Curve shape | 8.9 | 54 | T10Y2Y (+), DCOILWTICO (+), RVOL_trend (+) |
| PC5 - Dollar / commodity | 7.2 | 61.2 | DXY (+), DCOILWTICO (−), ICSA (+), MICH (−) |
| PC6 - Consumer sentiment | 6.3 | 67.5 | MICH (+), ICSA (+), MANEMP (+) |
| PC7 - Claims / dollar | 5.4 | 73 | ICSA (+), DXY (−), MANEMP (+) |
| PC8 - Housing / volatility | 5.1 | 78.1 | PERMIT (+), T10Y2Y (+), RVOL_trend (−) |
| PC9 - Commodity / credit | 4.9 | 82.9 | DCOILWTICO (+), DTB3 (+), BAA10Y_trend (+) |
| PC10 - Short rates | 4.2 | 87.1 | DTB3 (+), MANEMP (−), DXY (−) |